

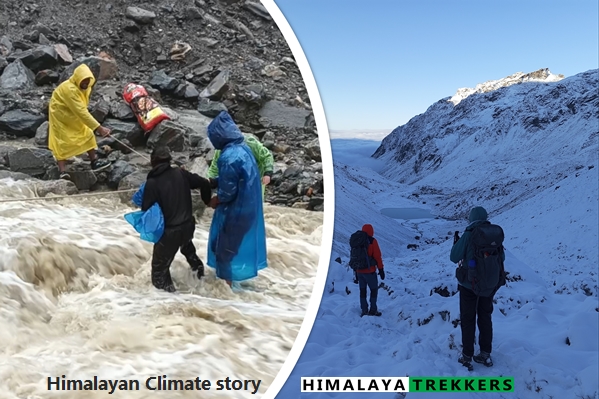
From Kolkata’s record-breaking five-hour/250-300 mm rains in late September to late-October deluges in Darjeeling, Sikkim, and Nepal, weather that used to be rare now arrives in clusters. This article connects the dots—from hidden ocean heat to Bay of Bengal and Arabian Sea storm engines, Western Disturbances, and the shrinking cryosphere of the Himalayan–Tibetan Plateau. We end with practical ways to plan better, travel lighter, and reuse more at home.
What we mean by the “Third Pole”
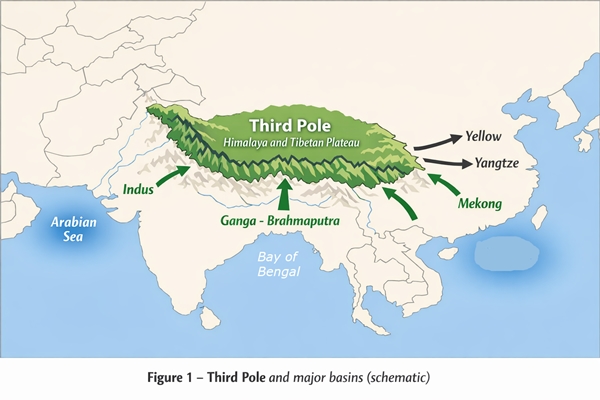
The Third Pole refers to the Himalayan–Tibetan Plateau and adjoining high ranges. It stores the largest volume of ice outside the Arctic and Antarctic and feeds Asia’s great rivers, supporting roughly 2.0 billion people downstream.
Think of it as Asia’s water tower—and as a sensitive climate barometer. [ICIMOD/UNESCO/Asian Water Tower]
Why the change feels sudden: hidden heat, visible extremes
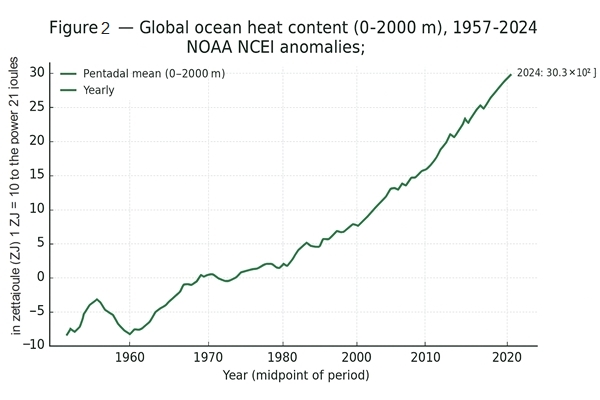
Over 90% of the extra heat trapped by greenhouse gases is absorbed by the oceans. That energy now primes the atmosphere for heavier rain, higher humidity, and longer warm seasons. In short bursts, it loads dice toward extremes.
This vast reservoir of warmth, measured as ocean heat content (OHC), has been climbing steadily since the mid-20th century . In fact, the upper 2000 meters of the ocean hit a record high heat content in 2023 – part of a trend that has seen the five highest OHC values all occur in the last five years . To grasp the scale: the increase in ocean heat between 2021 and 2023 alone (about 15 zettajoules) was roughly 25 times the total energy all human activities produced in 2021 . Such immense ocean warming may be out of sight, but it is not out of mind – its effects are felt in a stronger, wetter atmosphere and increasingly unpredictable weather patterns. Warm oceans fuel more evaporation and moisture in the air, which can translate into intense rainfall events and powerful storms. In the Himalayas, where the monsoon delivers life-sustaining rain, a warmer Indian Ocean can supercharge these rains one year and stall them the next, throwing age-old patterns off balance. The ocean’s memory is long: once heated, that water will continue affecting climate for decades, underscoring how today’s emissions are shaping tomorrow’s mountain weather.
- So what? Warmer oceans supercharge moisture supply; slow-moving systems dump more.
- Implication for treks: Shoulder seasons wobble; late retreats can still be wet and snowy.
Bay of Bengal & Arabian Sea: the storm engines
Bay of Bengal in the retreat season (Sep–Oct)
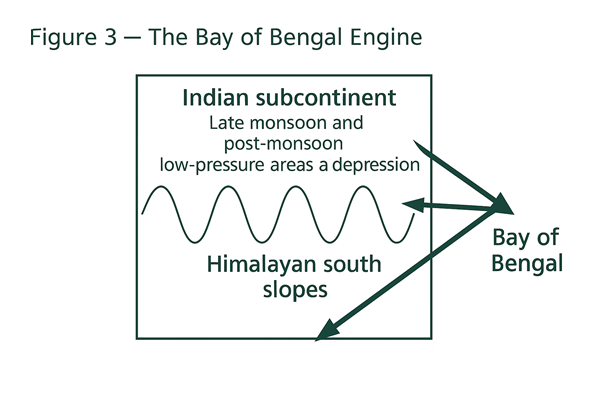
The Bay of Bengal spawns lows and depressions in the retreat phase, some intensifying toward cyclones and drifting into East/Northeast India or recurving northward along the coast.
Warm waters plus high humidity raise rainfall efficiency along the Himalayan south slopes. [IMD cyclone briefs; peer-reviewed BoB intensity trends]
Arabian Sea: faster strengthenings
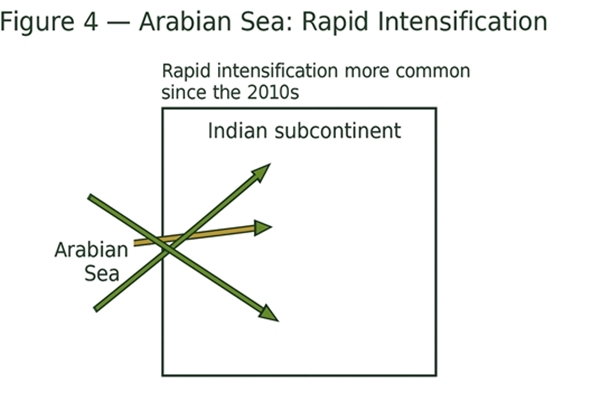
Arabian Sea cyclones have shown a higher likelihood of rapid intensification in warmer background conditions since the 2010s, altering risk on the west coast and sometimes feeding cross-peninsula moisture.
The basin is warming faster, and favourable shear windows can flip systems quickly. [Roxy et al.; Evan et al.; recent basin studies]
When systems couple: Western Disturbances meet Bay moisture
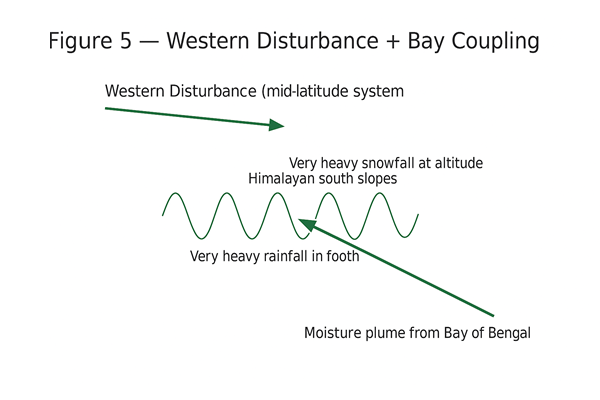
Mid-latitude Western Disturbances (WDs) can overlap with Bay moisture plumes. The coupling raises odds of very heavy rainfall in foothills and very heavy snowfall at altitude in shoulder months.
This is a known pathway for high-impact October/November events. [Dimri et al.; IMD synoptic discussions]
Late Oct 2025: IMD tracked Severe Cyclonic Storm Montha in the Bay of Bengal and issued “extremely heavy rainfall” alerts for Sub-Himalayan West Bengal and Sikkim on 31 Oct, coinciding with a synoptic setting that favoured a wet spell into the eastern Himalaya. [IMD press: 27–31 Oct 2025; news summaries]
Third Pole cryosphere: later snowlines, longer melt seasons
Warmer air and dustier atmospheres shift seasonal snowlines higher and prolong melt seasons. That changes mass balance in many glacierised basins and raises early-summer discharge followed by sharper late-season deficits. [ICIMOD synthesis; IPCC AR6 WG1/2]
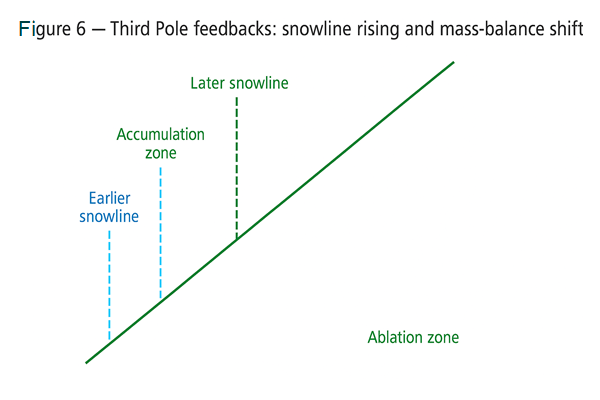
- So what? Earlier melt surges and later deficits alter bridge/ford safety, moraine stability, and water timing.
Glacial-lake outburst risk (GLOF): what triggers failure
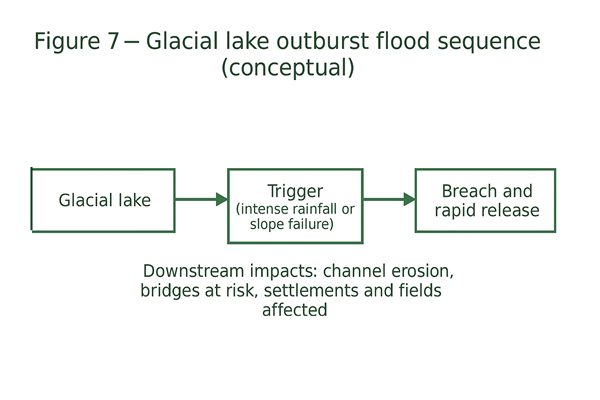
GLOFs often need a trigger—intense rain, melt surges, or a slope failure/ice avalanche splashing into a lake. Downstream, sediment-laden floods erode channels and stress bridges and roads. [ICIMOD; post-event studies incl. Sikkim 2023 Lhonak]
Compound events: when extremes stack
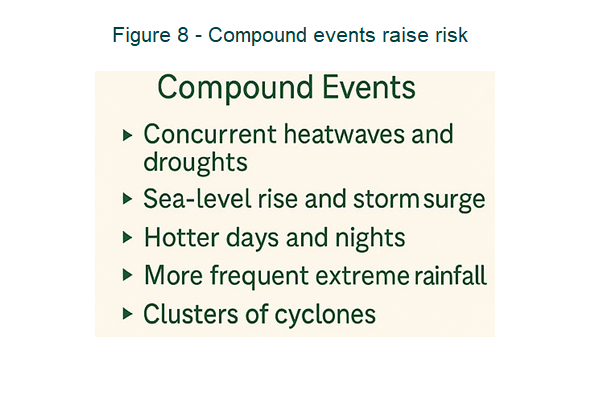
Impacts intensify when hazards coincide: rain on snow, slow-moving multi-day deluges, WD+Bay overlaps, or debris-rich floods. We track these in trek-week decisions.
- Week-ahead planning: We cross-check IMD + ECMWF, look for coupling setups, and sanity-check with Yr.no and Meteoblue.
- On-route tactics: Start earlier, add weather buffers, and update cut-offs for landslide/GLOF corridors.
Digital demand isn’t free: the web, AI, and electricity
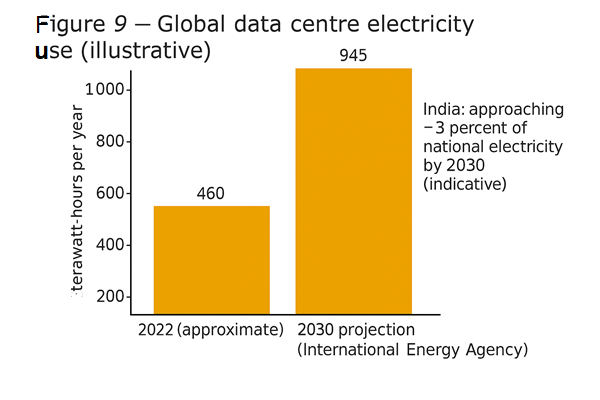
Data-centre electricity use is projected by the IEA to roughly double to ~945 TWh by 2030 (base case), up from ~460 TWh in 2022. Efficiency gains help, but absolute demand still rises. [IEA Electricity 2024; IEA Energy & AI 2025]
Recent India & Himalaya signals you can relate to
| Region & date | What happened | Why it matters |
|---|---|---|
| Kolkata, Oct 2025 | Second-wettest October since 2010; late-month rain also influenced by Cyclone Montha. | Warm Bay + slow systems = urban drainage stress. |
| Darjeeling–Nepal, early Oct 2025 | Floods/landslides with many fatalities reported across the border region. | Steep terrain + prolonged rain = high landslide risk. |
| East Himalaya, 31 Oct 2025 | IMD warned of “extremely heavy” rain over Sub-Himalayan West Bengal & Sikkim. | Retreat-season BoB system intersected with hill-belt orography. |
Seasons are shifting—and signals keep flipping
ENSO flipped through 2025—from early-year neutral to **La Niña present** by October per CPC. When background warming is high, even ENSO-neutral months ride on record-warm oceans.
Treat historical “best times” as guidance, watch the live signals. [NOAA CPC; NOAA State of the Ocean]
Plan better, travel lighter, reuse more
- Forecast workflow (HT): IMD primary → ECMWF HRES/ENS for trend → IMD Nowcast/Doppler for last-mile; check Yr.no & Meteoblue as adjuncts.
- On-ground buffers: Add weather holds; re-route to rain-shadow options when signals stack.
- Gear stance: Use synthetic where mission-agnostic, reserve down for critical warmth; repair/refill to extend life; **reuse before recycle**.
- Digital footprint: Prefer low-weight formats in the field; batch sync; cache maps.
Mountain weather changes quickly; treat season windows as guidance and check forecasts in the week you travel.



Comments